TONX API Dashboard Overview
Discover the TON API Dashboard by TONX. Monitor usage, manage API keys, and analyze blockchain activity with ease.
TON API request overview
One Home page
- You can view your TOP5 most active apps and how many requests they have sent in the past 24 hours.
- Analytics overview, including request health rate, request growth rate, and CU(Compute Unit) growth rate.
- Once you send a request, the request status will be shown on the dashboard in real-time.
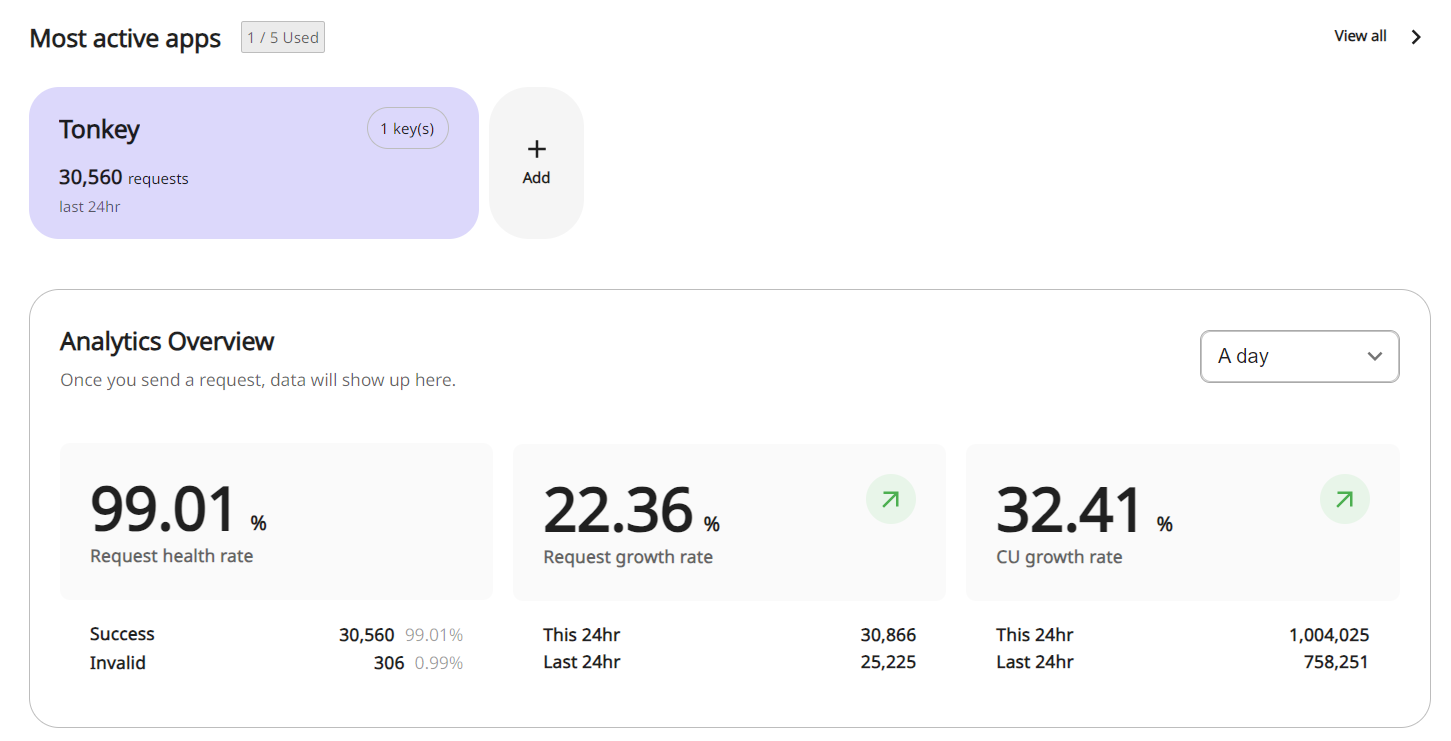
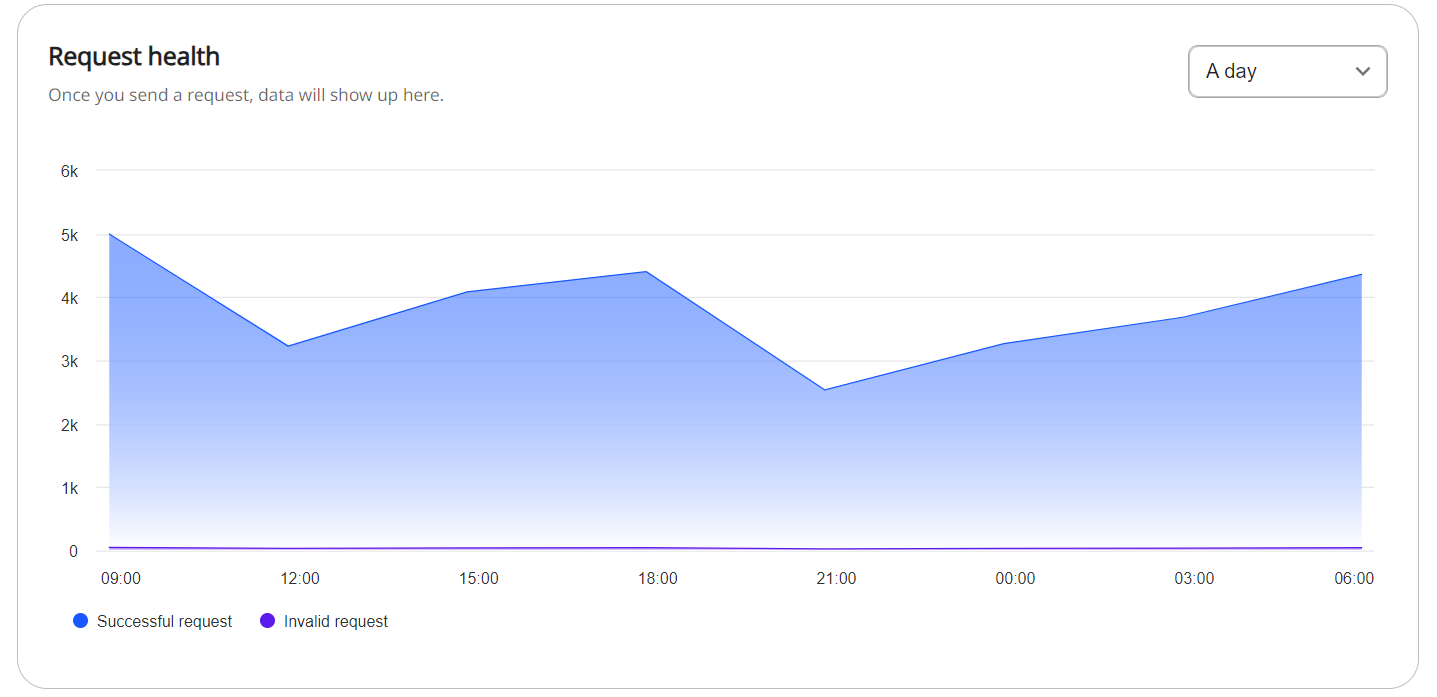
If you want to view the details of the request status.
- Click STATS at the left sidebar menu
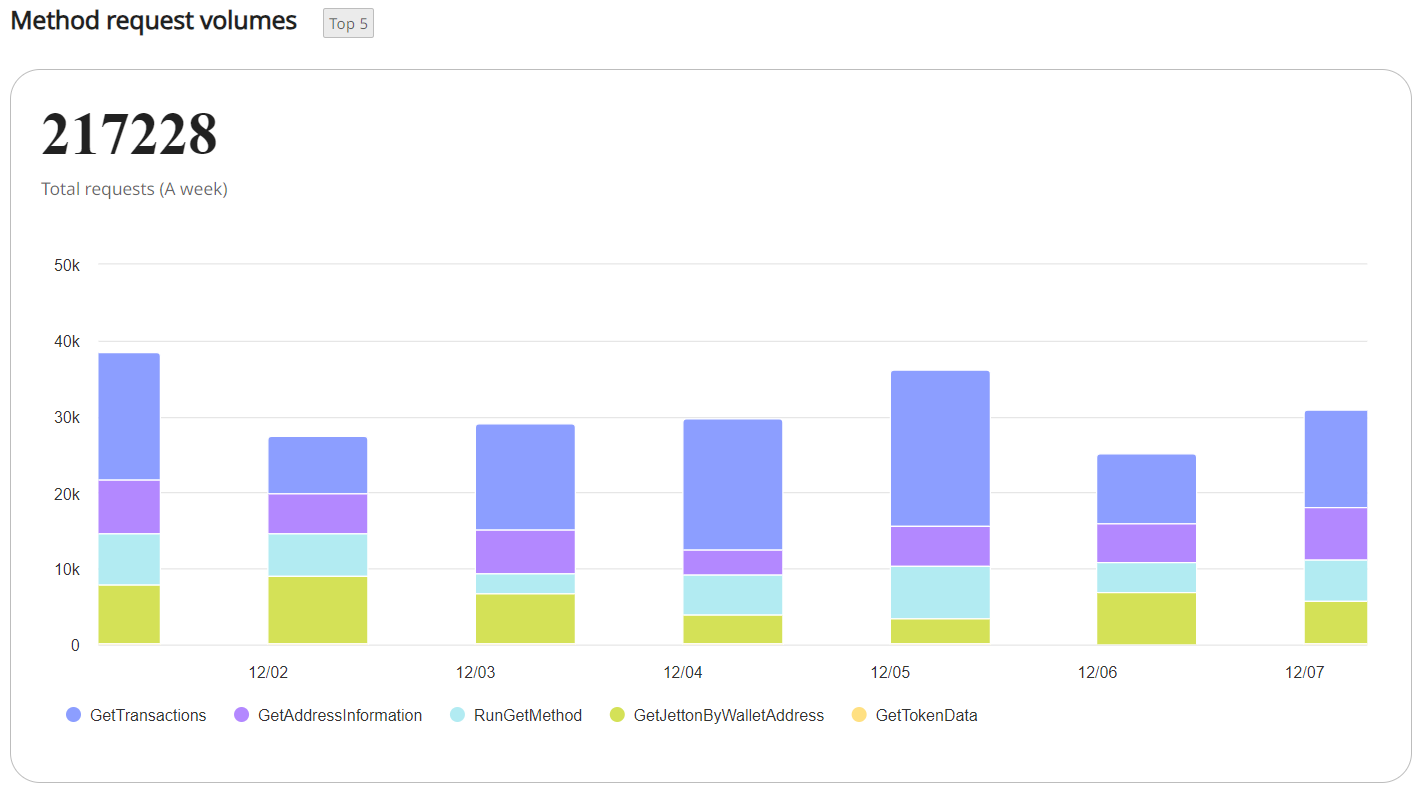
You can view the total volume of requests sent to TONX API over the selected time period.
- Select App / API key / Time period

- View Total request volumes
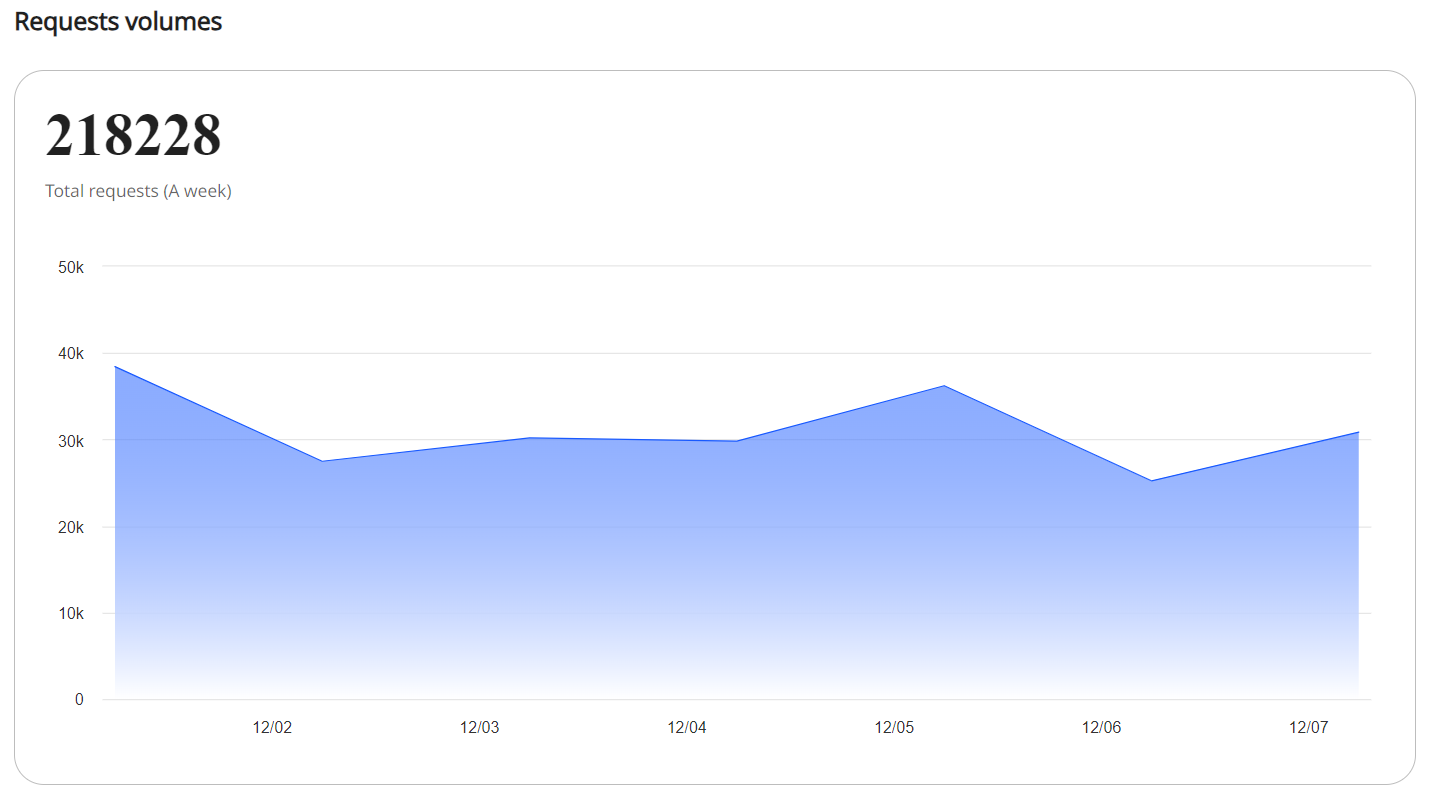
- View Top5 Method request volumes
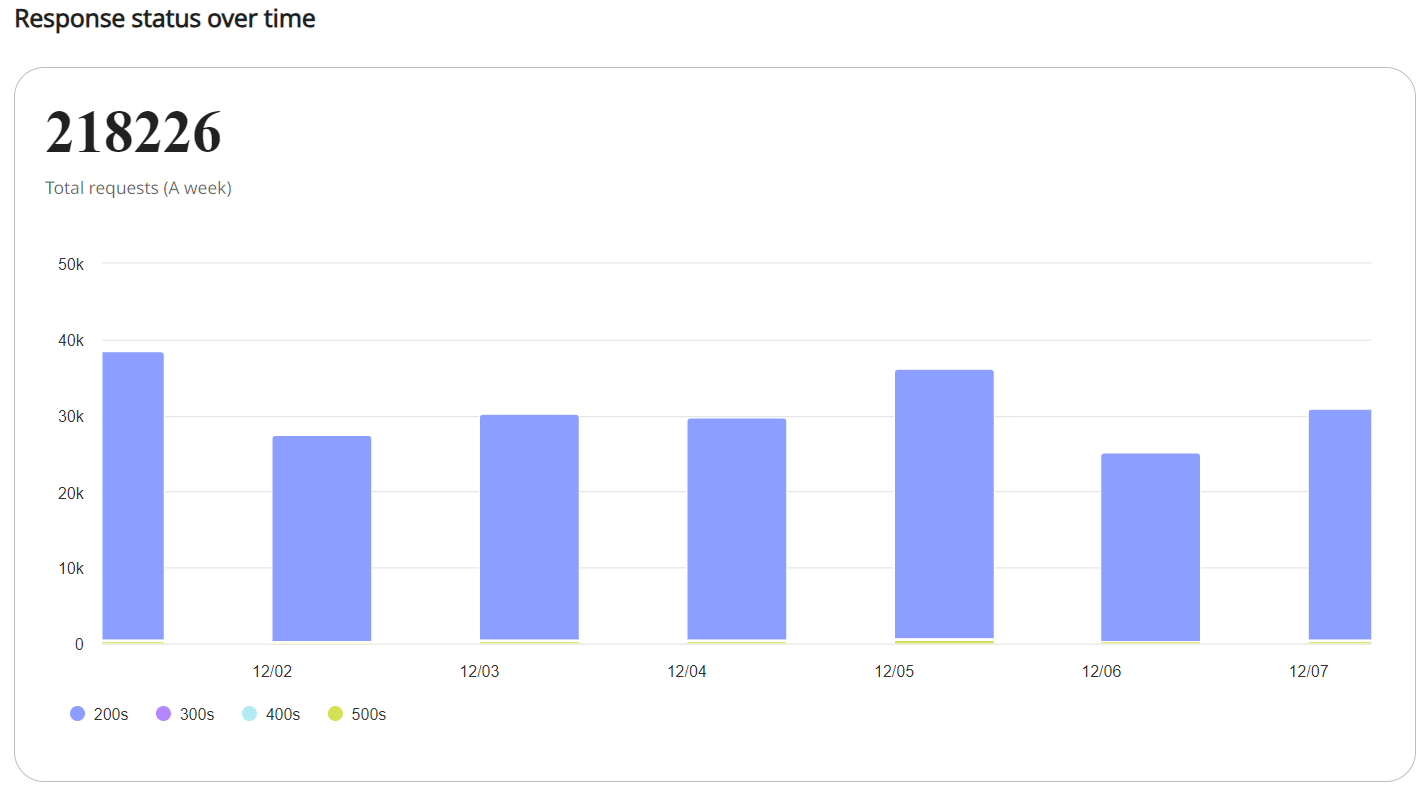
- View Response status over time
- Resource list
(1) You can view all the methods you have used, along with their request volume and success and failure rates.
(2) and break down the status of each API method.
What does each status mean?
200: OK. The request succeeded. success status response code indicates that the request has succeeded. A 200 response is cacheable by default.
500: Internal Server Error The server has encountered a situation it does not know how to handle.
If you want to learn more, please refer to error reference.
Updated over 1 year ago
